Data Visualization · AP Computer Science Capstone, 2021 · Rebuilt for the web, 2026

Tracking the COVID vaccine
rollout, state by state.

An interactive map of COVID-19 vaccinations, cases and deaths across all 50 states and DC. It started as a three-person Java desktop app for our high school AP Computer Science capstone. I've since rebuilt it as a web dashboard covering the full archive, from March 2020 to March 2023.

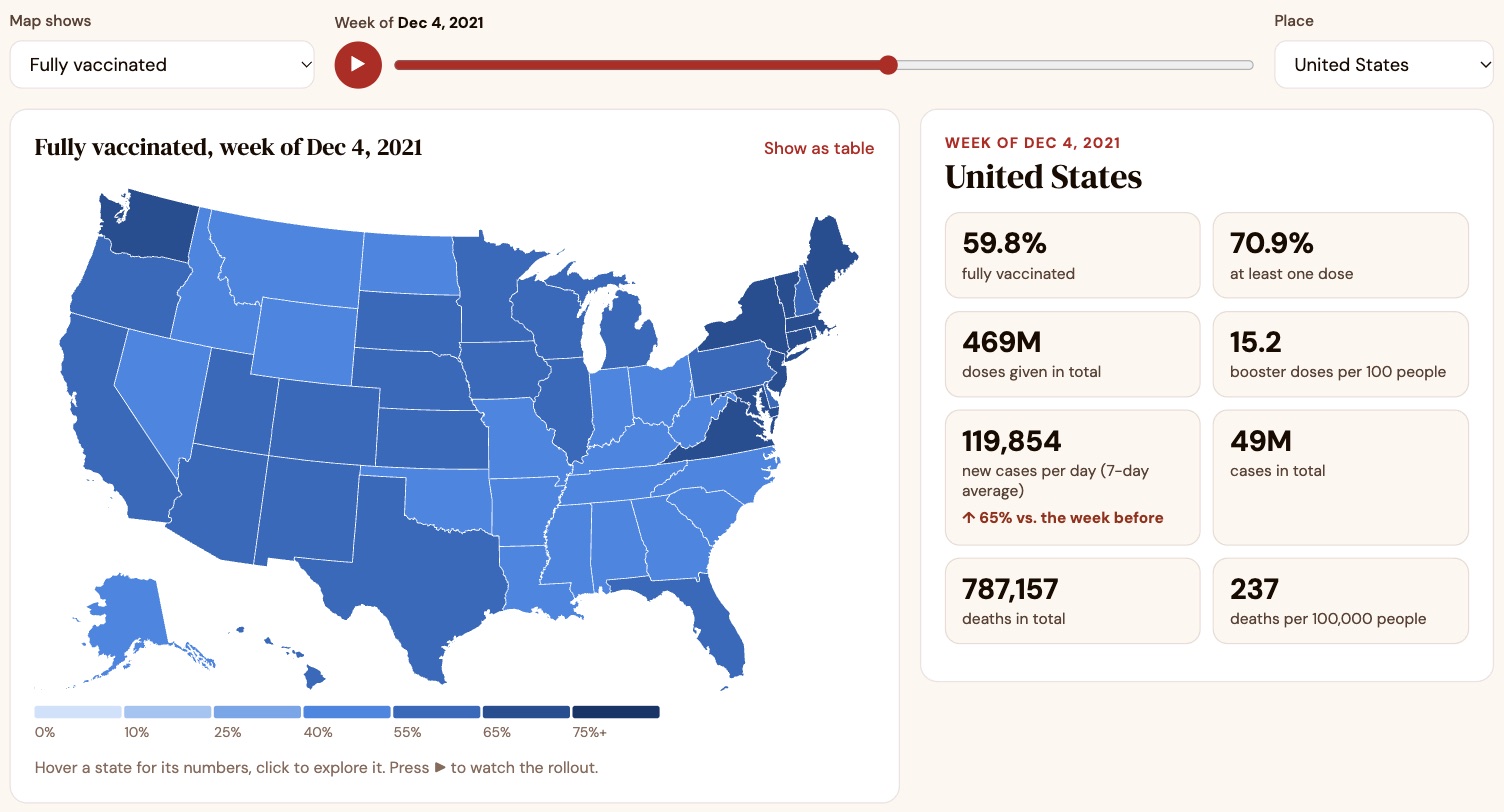
The dashboard: a US map colored by percent fully vaccinated in December 2021, a timeline slider, and US totals such as 59.8% fully vaccinated and 469 million doses given.
51
States + DC on the map
159
Weeks of data, 2020–2023
3
Teammates on the original
2,800
Lines of original Java

A 2021 wishlist, finally built.

Our 2021 design doc listed features we wanted but didn't have time for. The web version is built around them.

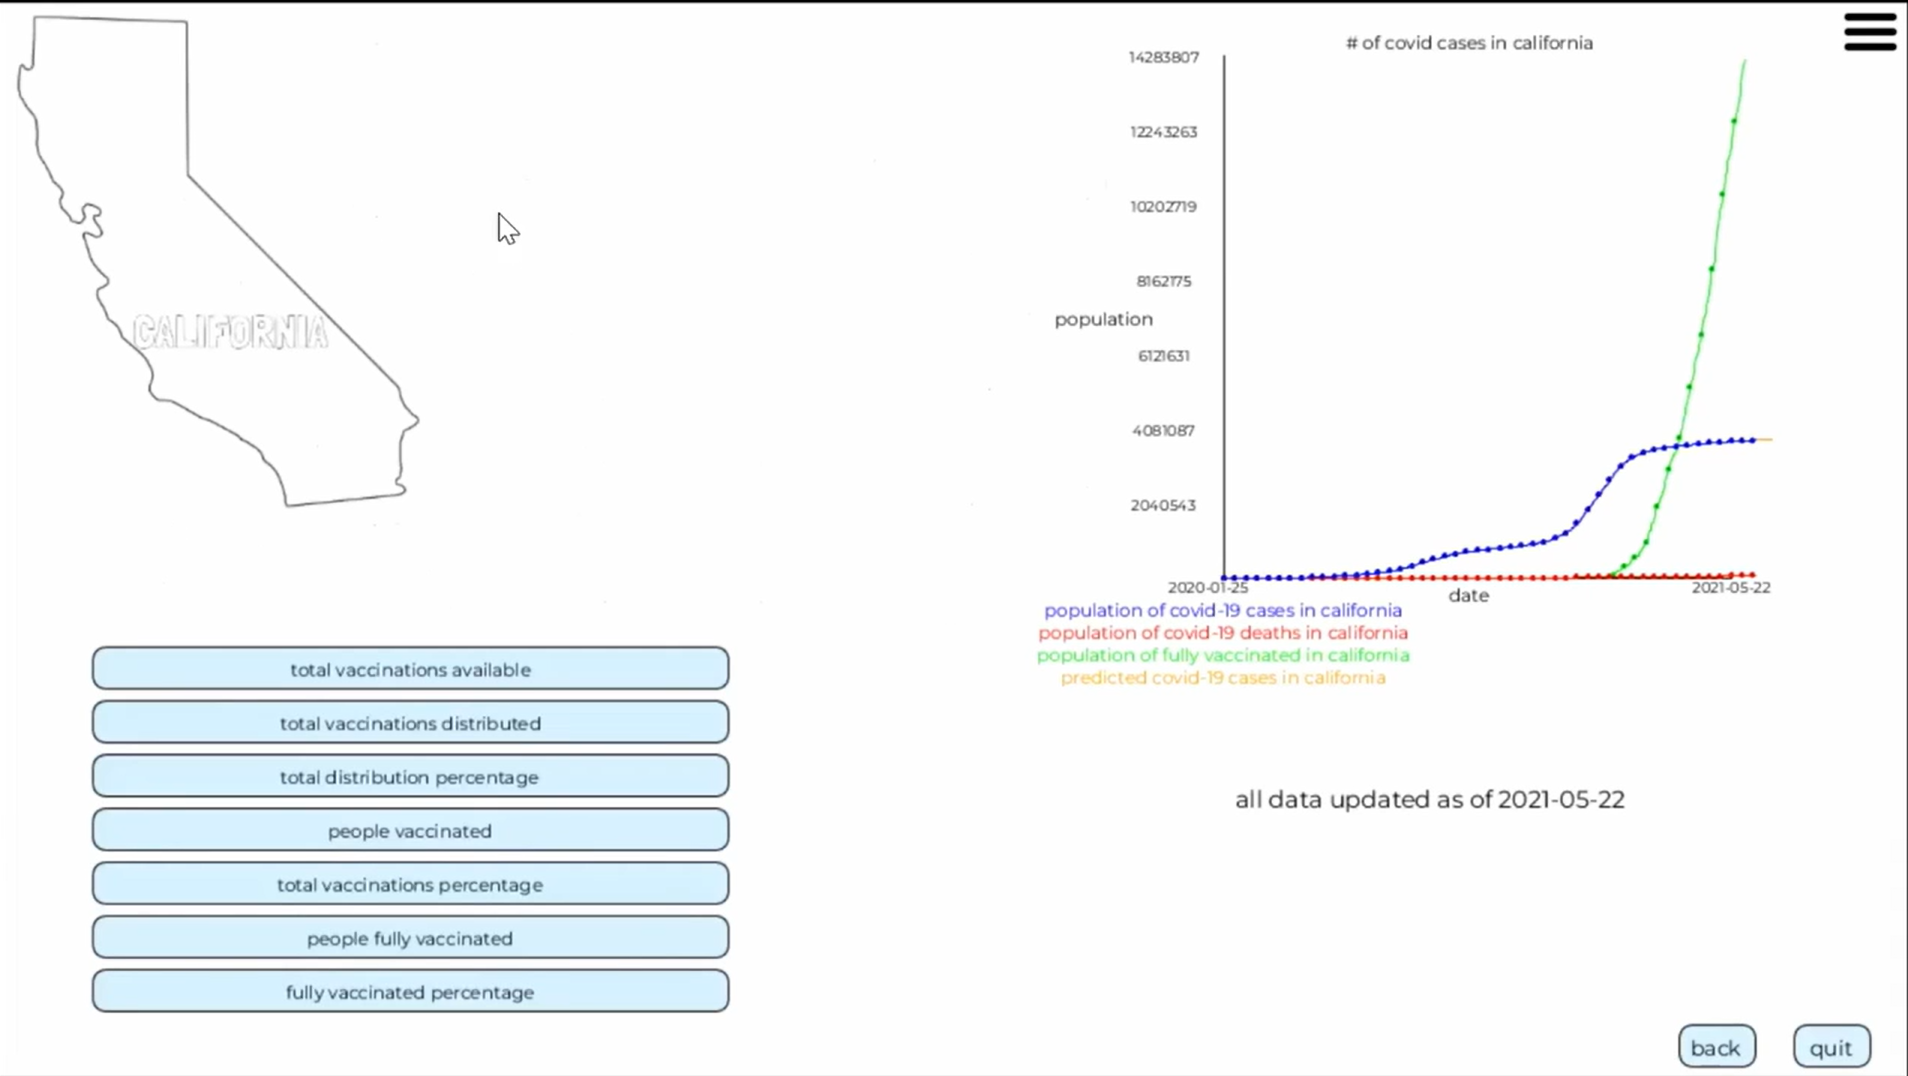
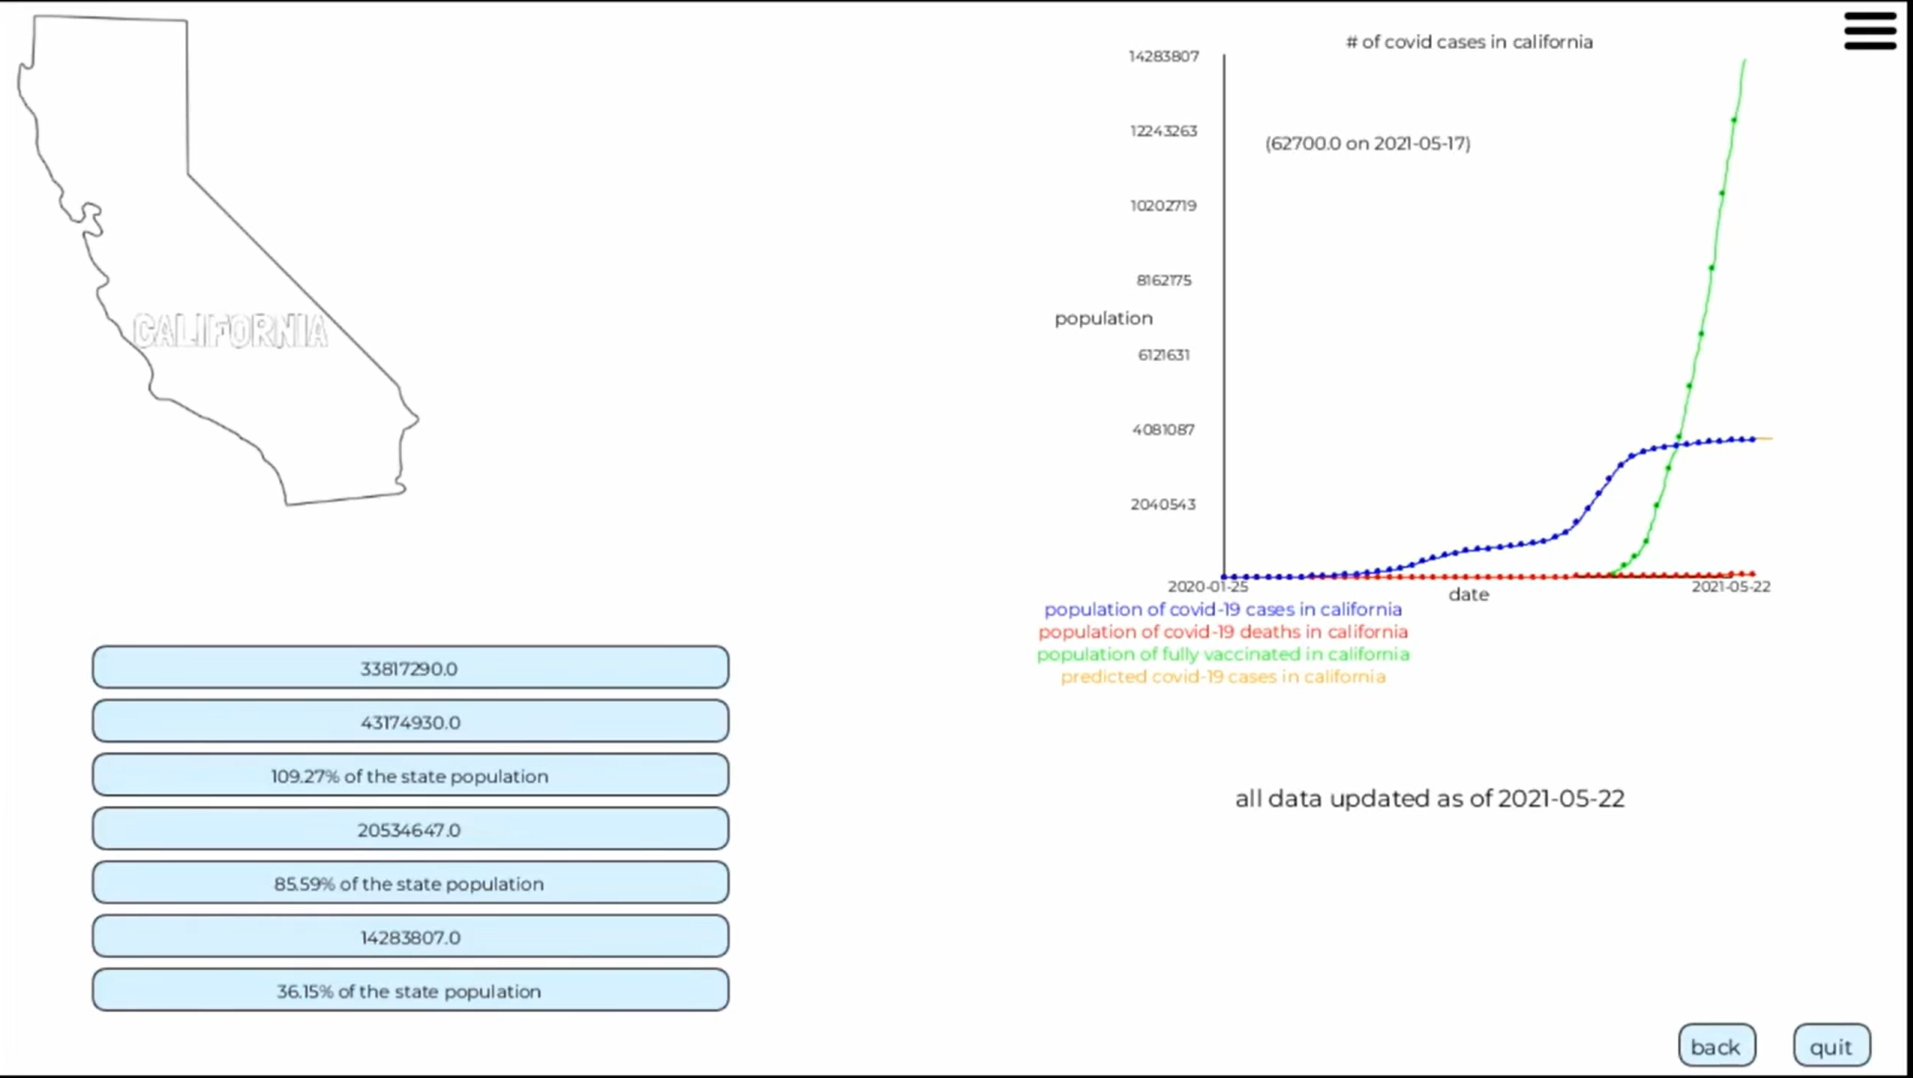
2021 · Java + Processing desktop app

  • Downloaded the latest CSVs on launch and redrew the charts
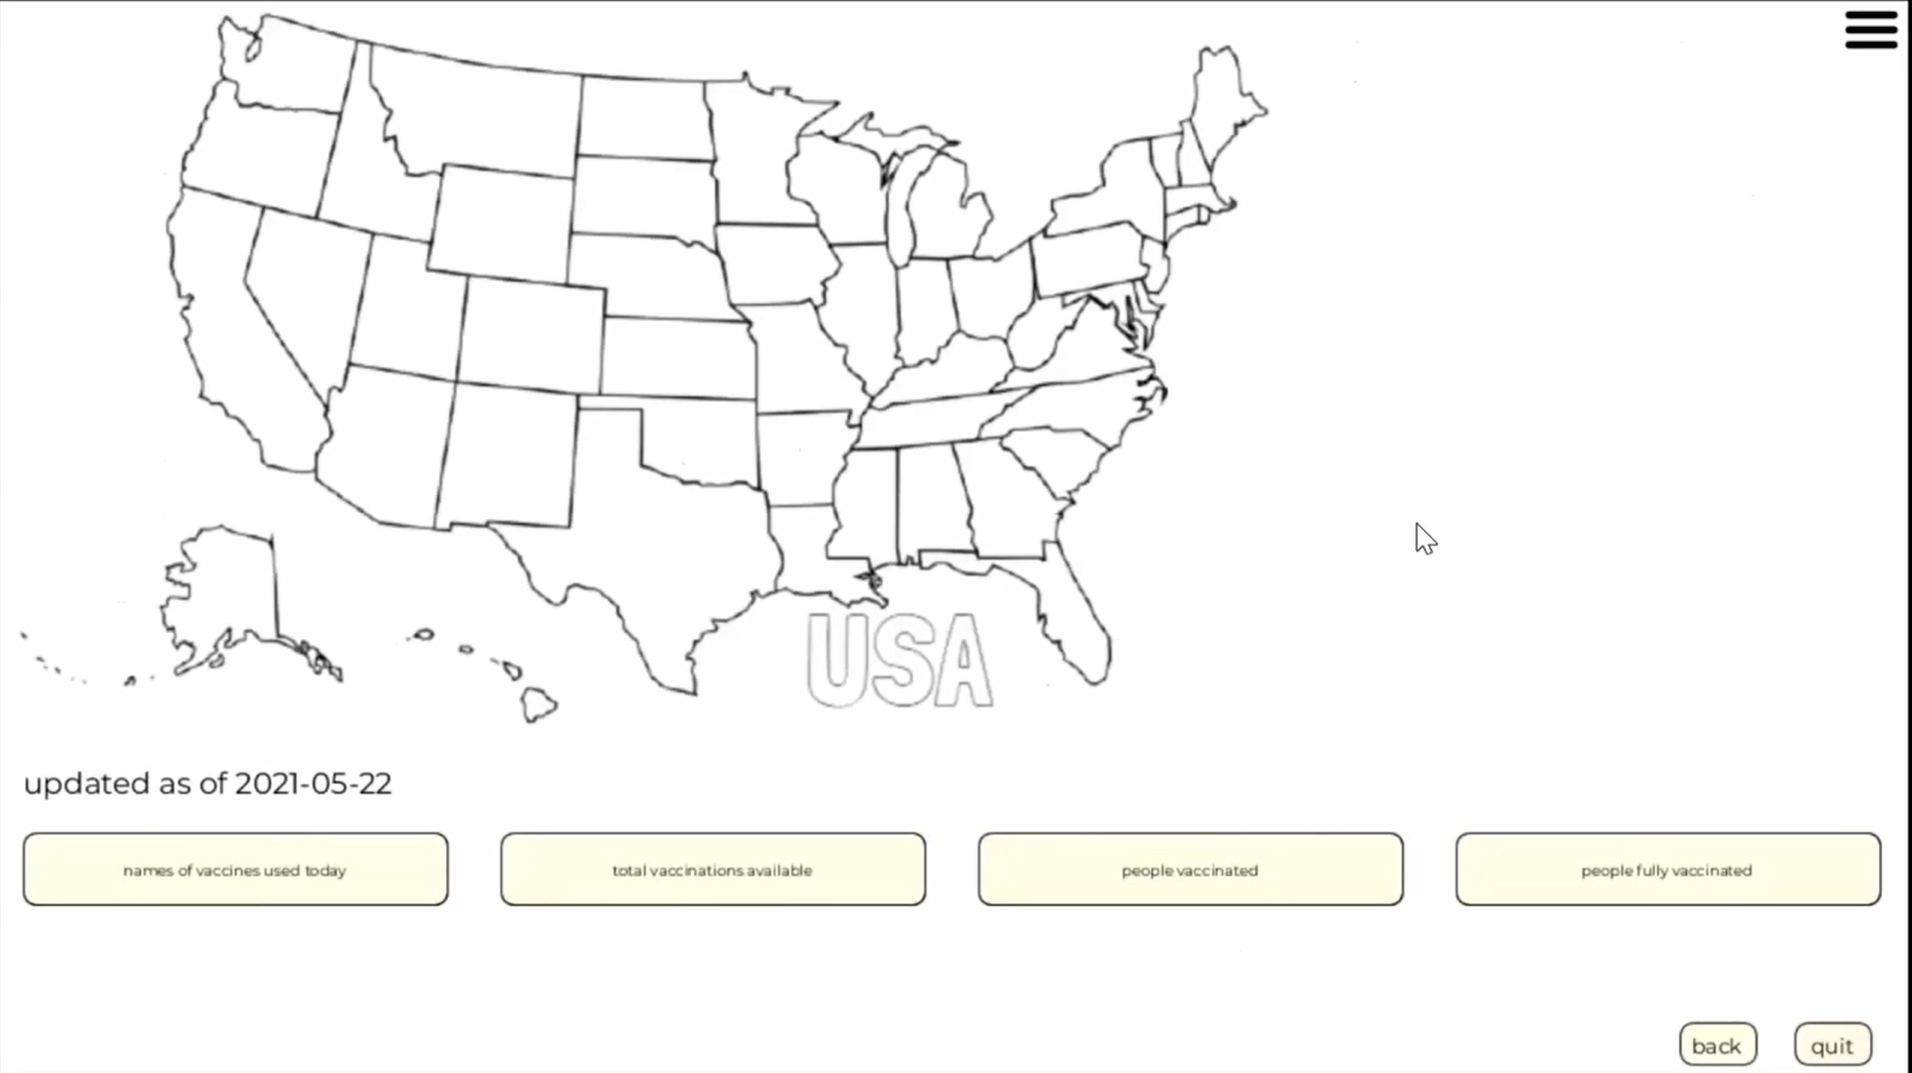
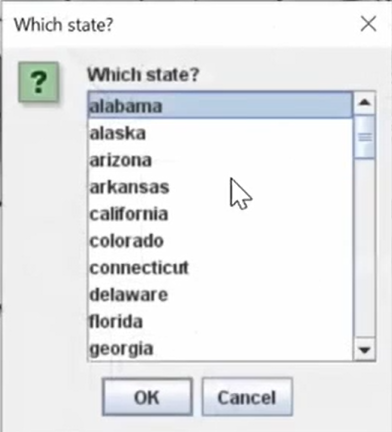
  • A map of state outlines with a dropdown to pick a state
  • Stat buttons per state: doses, percent vaccinated, cases up or down
  • Per-state line charts, including a hand-tuned case prediction
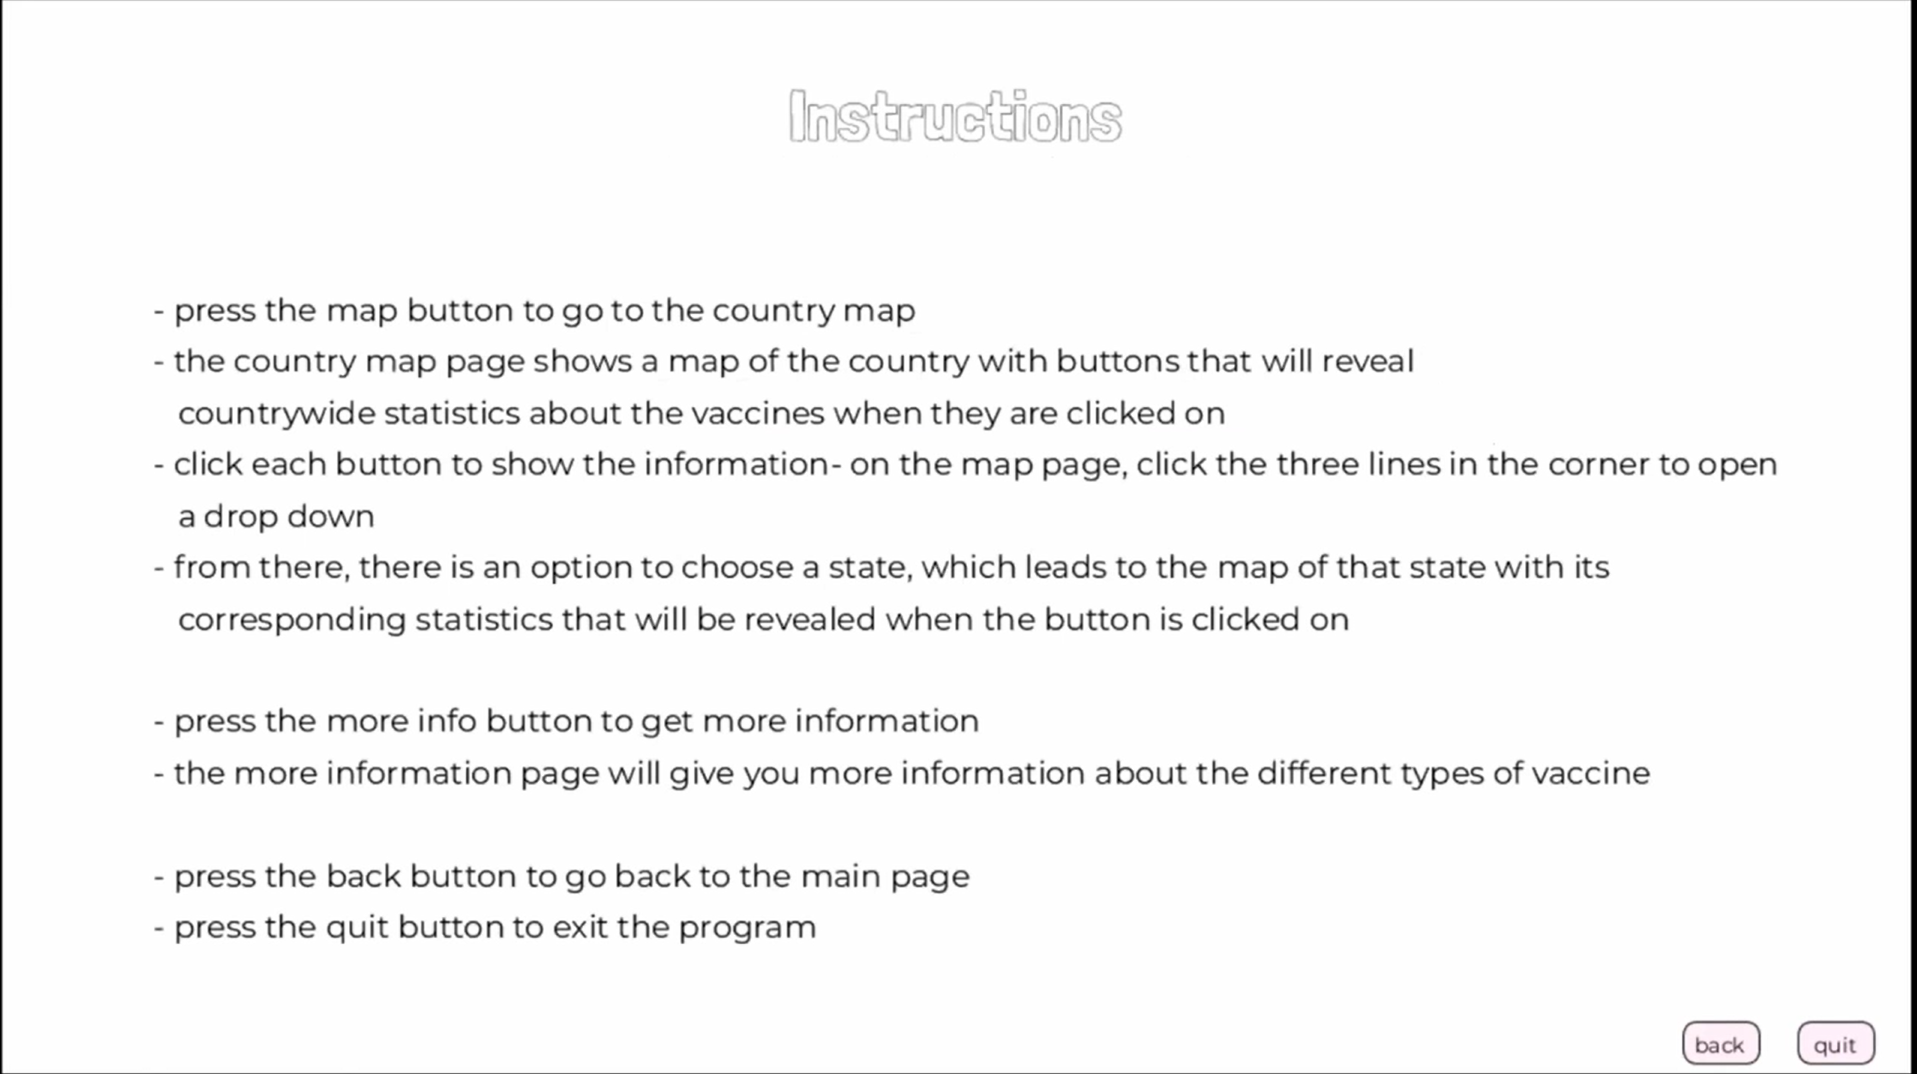
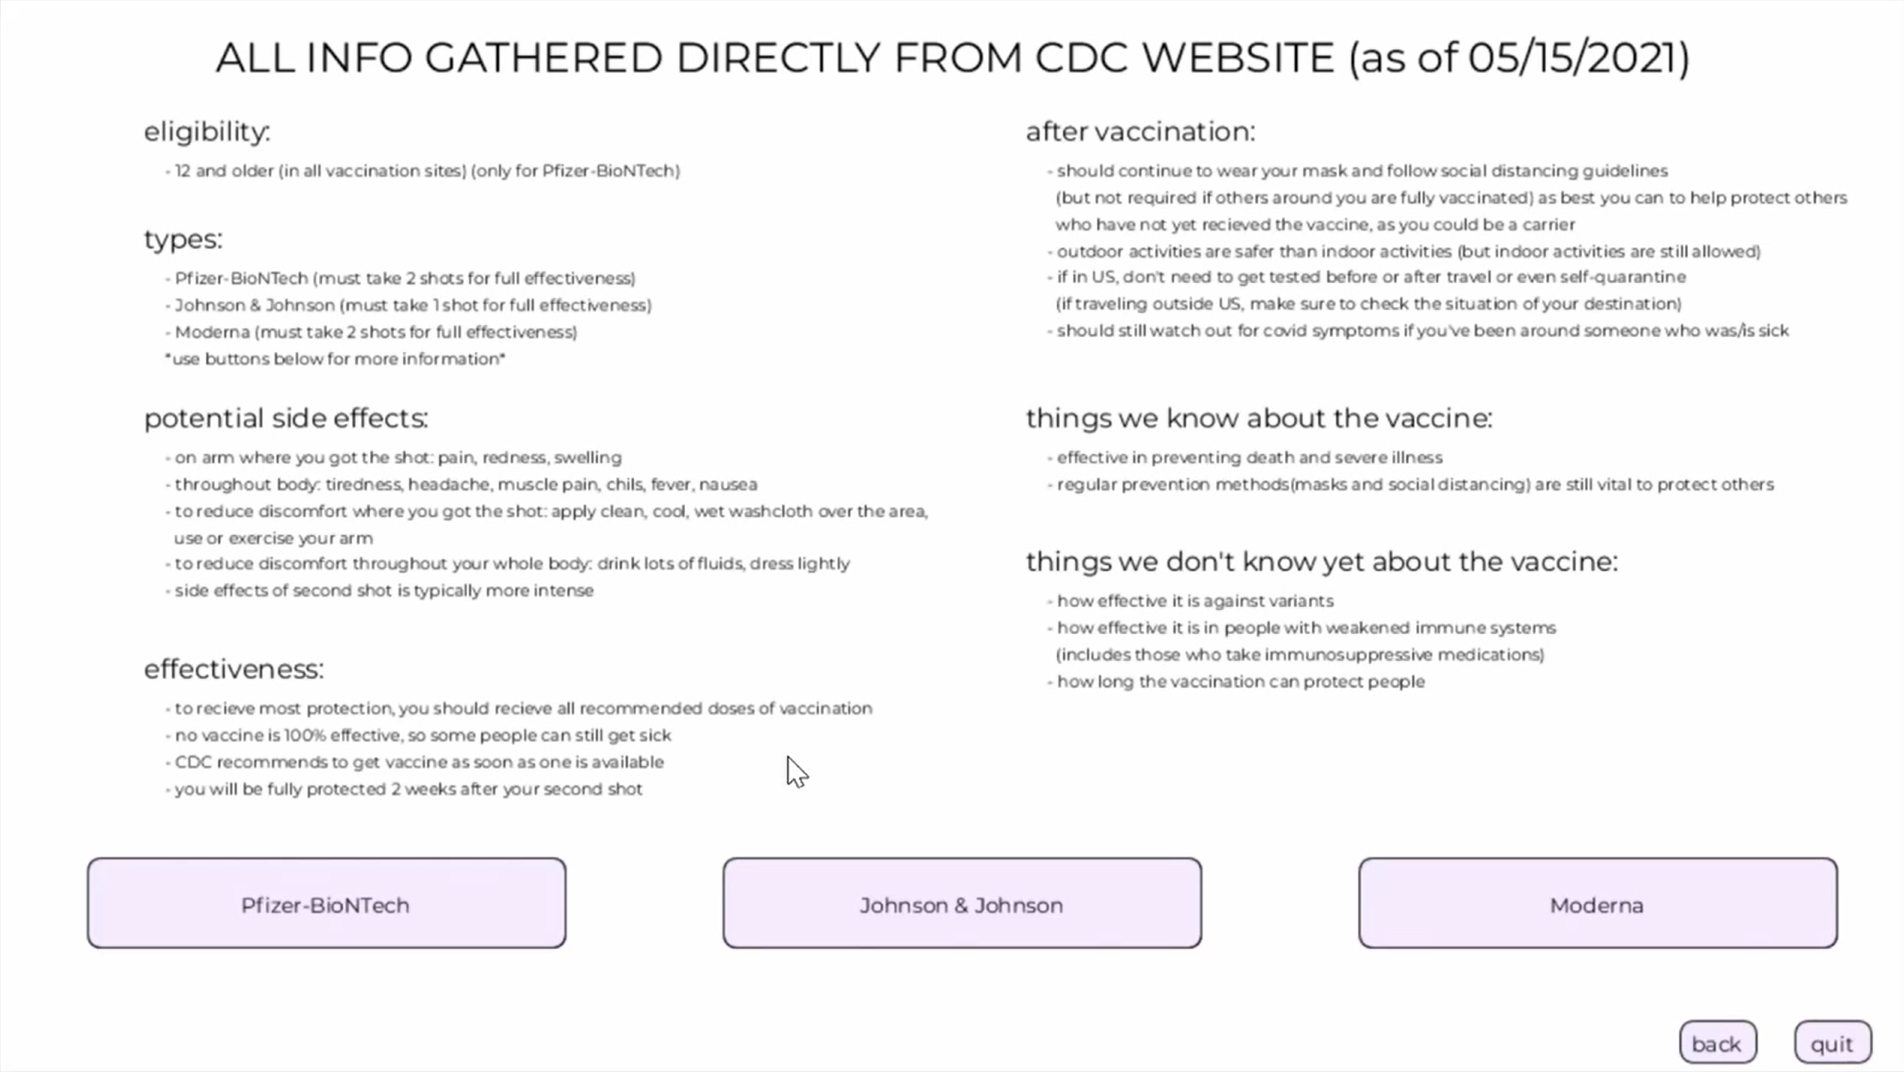
  • A "More information" page summarizing the CDC

2026 · Web dashboard

  • "Color each state by percent vaccinated": a choropleth for five measures
  • "View statistics from previous weeks and months": a timeline you can scrub or play
  • "Hover over a state": tooltips, click to explore, keyboard and table access
  • "Publish it into a website": runs in any browser, no install
  • New: a trend forecast checked against what actually happened, and doses by maker
Built to make public health data
actually public.

🗺️
Map with a timeline

Color the US by percent fully vaccinated, at least one dose, boosters, new cases or deaths per 100,000 people, then scrub or play through 159 weeks to watch the rollout and each wave.

📍
Every state up close

Pick a state to see its numbers for that week, whether cases went up or down since the week before (the original app's headline stat), and charts comparing it with the whole US.

📈
A forecast you can check

From any week, a simple 3-week trend projects cases two weeks ahead and shows what really happened, plus how far off that trend is across the whole pandemic. It famously misses Omicron.

💉
Vaccines then and now

US doses by maker through March 2023, alongside what the original app told people in May 2021, kept as a snapshot of what was known at the time.

From public datasets to insight.

01
Same sources as 2021

Cases and deaths from The New York Times, vaccinations from Our World in Data (compiled from the CDC). Both stopped updating in 2023.

02
A Python data build

scripts/build_data.py turns 15 MB of daily CSVs into a 395 KB weekly snapshot, filling gaps in states' reports and marking those weeks as estimated.

03
D3 in the browser

D3 and TopoJSON draw the map and charts as SVG, with fixed color scales so a color means the same thing every week.

04
Honest by default

Estimated weeks are labeled, DC's over-100% figures are explained, and every map has a table view.

Built with purpose-fit tools.

Web dashboard (2026)

📊 D3.js
🗺️ TopoJSON + us-atlas
⚡ JavaScript
🐍 Python data pipeline
🚀 GitHub Pages

Original app (2021)

☕ Java
🎨 Processing
🌐 java.net.URL CSV downloads
⏱️ TimerTask auto-refresh

Who built what.

Roopa Srinivas

2021: the map and state pages (Country, State, MoreInfo classes), the state dropdown, the app frame and map images.
2026: the web dashboard and data pipeline.

Sophie Lin

2021: page transitions and buttons, the instructions page, graphics and layout, the presentation video.

Nodoka Shibasaki

2021: data download and parsing, the statistics and graphs, the case prediction, hovering, auto-updates.

Want to explore or build on it?

Both versions are on GitHub: the original Java app and the web dashboard with its data pipeline.